What Telemetry is
Telemetry is a unified platform for the digital workplace. It collects the condition of every endpoint and keeps the evidence behind it, so operations teams and the systems they rely on work from facts they can trust.
A lightweight native agent on Windows, macOS and Linux devices captures resource performance, host context and installed software. Applications can also send standard OpenTelemetry metrics and logs. Everything lands in a single PostgreSQL store. Fleet teams see it in one console and can query it in plain English. Partner systems such as software and hardware asset management read it through defined, secure interfaces.
The proposition: give operations a clearer picture of the fleet, give integration partners dependable facts, and keep the meaning and quality of every observation intact as it moves between systems.
What it does
A native agent for Windows, macOS and Linux, shipped as a single standalone binary. It captures CPU, memory, disk and network readings, plus latency and battery where available. It also records host state (sessions, VPN, containers, foreground activity, sampled processes), hardware specifications and installed software. Threshold alerts and host events support fast incident triage.
Each kind of fact is collected on its own schedule: resources every 60 seconds, alert checks every 30 seconds, operational state every 5 minutes. Hardware and software inventory are sent only when they change, and state collection slows when the user is idle. Design targets are under 1.5% average CPU and under 20 MB of memory.
Metrics, logs, current device state, state history and inventory are held in one PostgreSQL system, not scattered across tools. Schema changes are versioned and reviewed, and retention is controlled: high-volume metrics and logs expire on a set schedule while device state and inventory are preserved.
See which devices are online and under resource pressure, then drill into one device to see what changed. Every view separates a genuine zero from missing data, shows when each observation was taken, and flags partial collection. Operators can also send desktop notifications and interactive pop-ups to endpoints.
Applications and services can send standard OpenTelemetry (OTLP over HTTP) metrics and logs. The platform keeps their full meaning: metric type, unit, dimensions, delta or cumulative counting, histograms and exemplars, nanosecond timestamps, and producer context.
Teams ask questions in plain English and get answers from governed reporting views. Queries run under the asking user’s verified identity and read-only access.
Software asset management (SAM), hardware asset management (HAM) and other authorised systems read device facts through versioned REST APIs and a read-only MCP interface. They receive a consistent baseline snapshot, then a running change feed with their own checkpoints and automatic recovery from gaps.
Each interface has its own credentials. Partner access uses short-lived signed tokens with explicit, server-controlled read grants, so a partner sees only what it has been granted. Operators sign in through the corporate directory (LDAP) with role checks.
What sets Telemetry apart
Most endpoint monitoring tools show you a reading. Telemetry shows you the reading and how far you can trust it, and carries that trust all the way into the systems that act on it.
Evidence you can trust, not just data. Every observation carries its quality with it: whether a value is a true zero or simply missing, when it was observed, and whether collection was complete. Dashboards, exports, reports and partner feeds all keep these distinctions, so a silent device is never mistaken for a healthy one and stale data is never treated as current.
Safe automation for licence and asset decisions. Telemetry keeps the facts separate from the business decisions. It will not let missing or stale data be read as "software unused" or "device retired". SAM and HAM systems get the facts together with confidence and completeness markers, so licences are not reclaimed and assets are not reassigned on false evidence.
Endpoint agent and OpenTelemetry in one open store. Device telemetry from the native agent and application telemetry from standard OpenTelemetry producers sit side by side in one PostgreSQL system that you own. Counters stay counters and histograms stay histograms. Nothing is flattened into averages, and there is no proprietary data lake to unlock.
A partner-grade synchronisation contract. Each partner system receives a consistent baseline, then a commit-ordered change feed with its own checkpoint. If a partner falls behind or its access changes, the platform detects the gap and rebuilds that partner’s baseline automatically. Late reports never overwrite newer facts.
One governed source for people, partners and AI. Operators, plain-English reporting, REST integrations and AI agents over MCP all read the same canonical facts under the same scoped, server-controlled access rules, so every consumer sees the same answer.
How it works
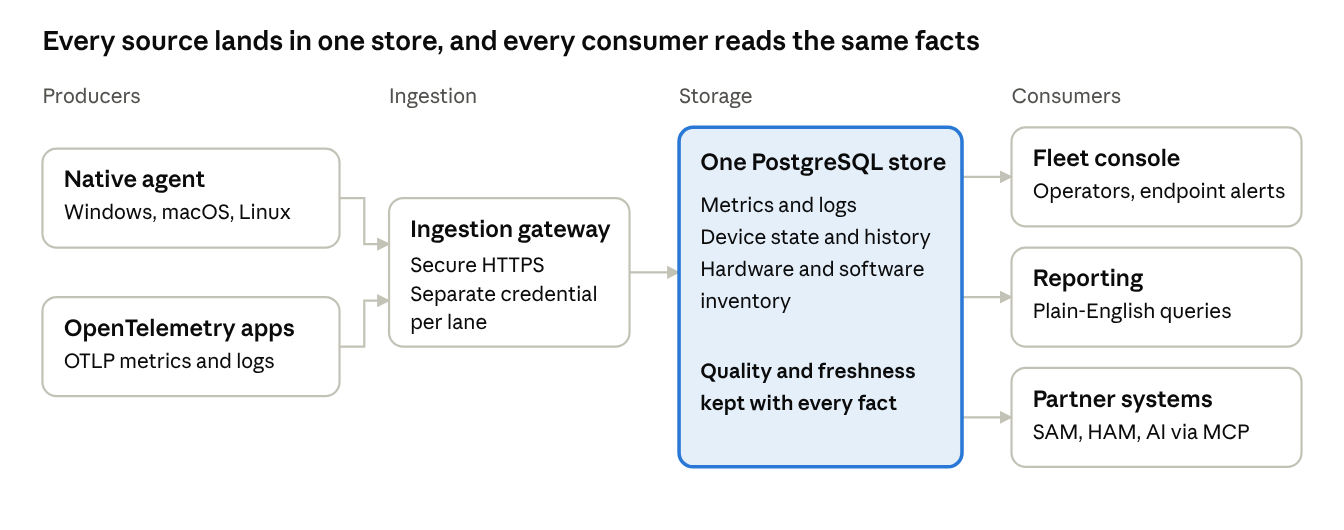
Collection, storage, reporting and business decisions are kept deliberately separate. Telemetry owns collection, evidence quality, ingestion and the reporting contracts. Asset custody, software entitlements and lifecycle decisions stay with the business systems that own them.
Getting started
Start with one representative fleet and one integration outcome, prove it end to end, then expand on measured results.
Define the use case: the producer or consumer, the facts needed, freshness and quality expectations, and the business owner.
Agree authority: deployment boundary, credentials, access grants and privacy review.
Build and qualify: test against your own environment, confirming accurate values, reliable reporting, and recovery from retries and failures.
Activate: a scoped rollout with clear operational ownership and monitoring.
Expand with evidence: add devices, partners and signals once endpoint footprint and load results are confirmed for your estate.
Capabilities described reflect the platform as of October 2026. Performance and footprint figures are design targets; each deployment is validated on representative endpoints.